How to Do a Catch Cup Test on Your Sprinklers
A sprinkler zone that looks fine can still leave one corner with half the water of another. This guide walks through the cup test step by step and turns your measurements into inches per hour, uniformity and run time.

By Daniel Reeves, PE, CID
Irrigation Design Engineer
Short answer
Do a catch cup test by setting out about 24 straight-sided cups across one zone, running it 5 to 20 minutes, and measuring the depth in each cup.
Average depth × 60 ÷ run minutes is your precipitation rate in inches per hour. The average of the driest quarter of cups ÷ the average of all cups is your uniformity, and 0.70 or higher is the goal.3 Run spray heads 5 to 10 minutes and rotors 10 to 20, and test when wind is 5 mph (8 km/h) or less.12
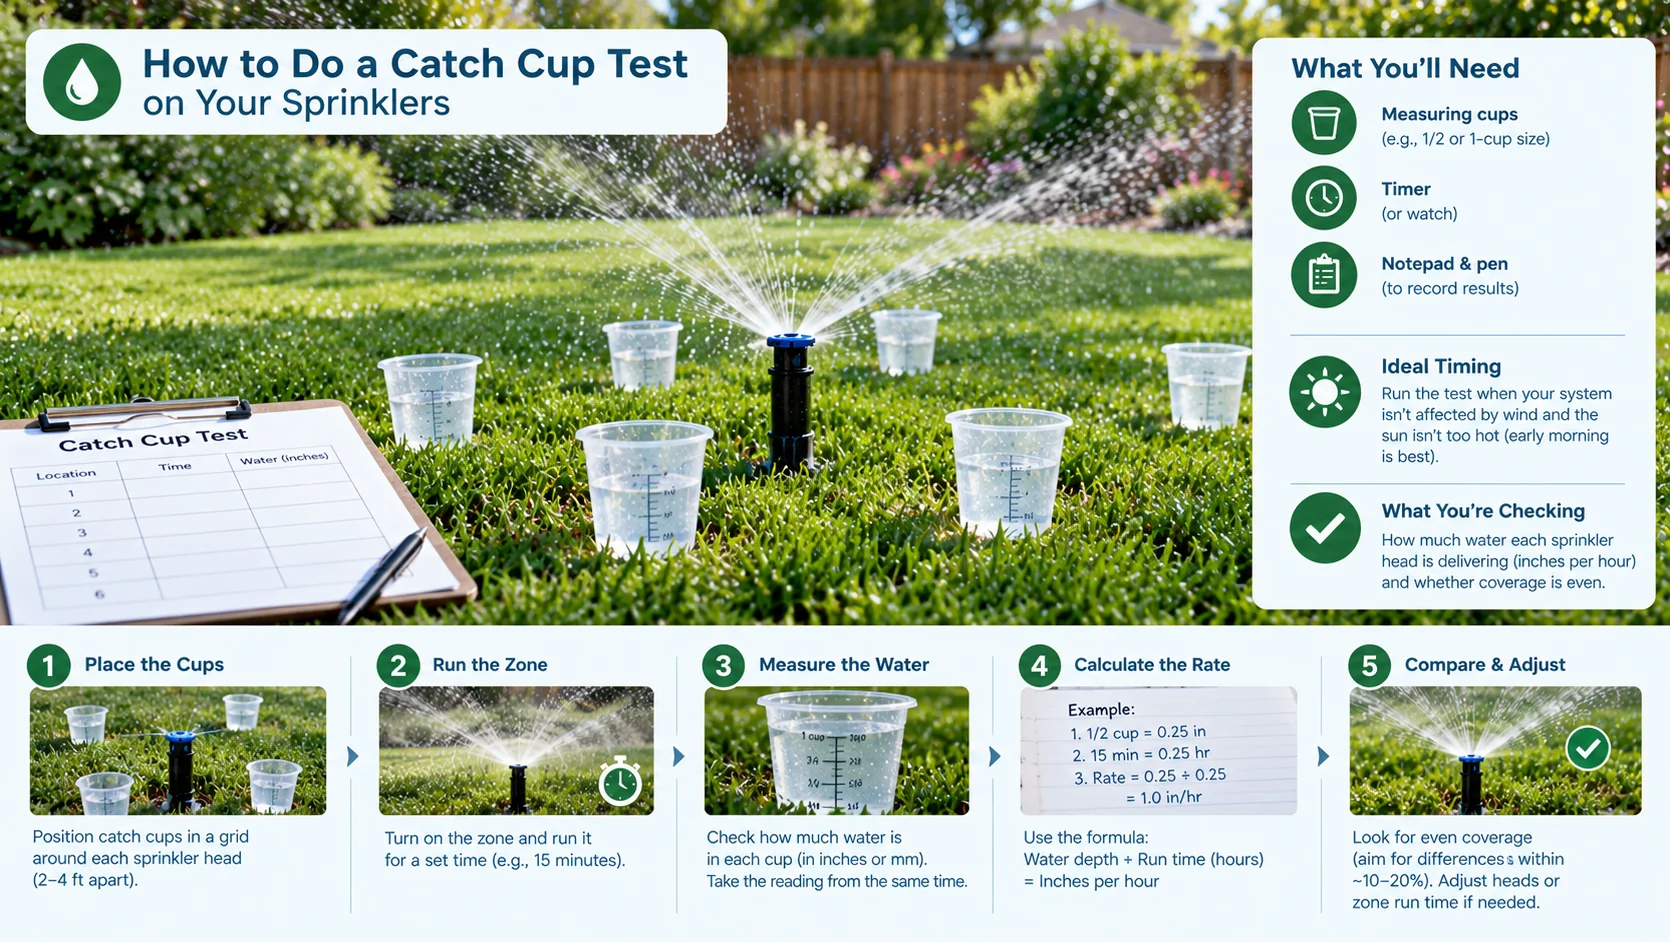
A sprinkler zone can look fine from the patio and still leave one corner with half the water of another. The only way to see that is to catch the water and measure it. The catch can test calculator does the arithmetic, and this guide covers the field work that produces the numbers.
Below you get supplies, cup placement, run times, the two formulas, a fully worked example and fixes for a poor score. The method also works on a hose-end sprinkler, and the hose-end sprinkler output calculator gives you a figure to compare against.
Key takeaways
- The test measures precipitation rate in inches per hour and distribution uniformity, a score for how evenly the zone is watered.
- Use at least 24 straight-sided cups per zone, run spray heads 5 to 10 minutes and rotors 10 to 20, and test in wind of 5 mph (8 km/h) or less.
- Precipitation rate = average depth × 60 ÷ run minutes. Uniformity = average of the driest quarter of cups ÷ average of all cups.
- Aim for 0.70 or higher. NMSU rates 0.55 as “good” for fixed sprays and 0.65 for rotors, and anything lower calls for repairs first.
- Divide the target depth by uniformity to set run time, but treat a large correction as a hardware problem.
- Retest on the same cup spots after every repair, and at least once a year.
What does a catch cup test tell you?
The test collects the water your sprinklers actually deliver and turns it into two numbers. The first is precipitation rate, the average depth applied per hour. The second is distribution uniformity (DU), a score for how evenly that depth is spread across the zone.2
A controller only knows minutes, so both numbers matter. Typical fixed spray heads apply 1.25 to 1.5 inches per hour (32 to 38 mm/h) and rotors 0.5 to 0.75 inch per hour (13 to 19 mm/h),5 so ten minutes on each puts down very different depths. The sprinkler precipitation rate chart lists reference values, and the sprinkler precipitation rate calculator estimates a rate from head data when you cannot test.
Uniformity decides how much water you waste. Auditors most often use the low-quarter version, DULQ, which compares the driest quarter of the cups with the average of all of them.4 A zone can hit the right average and still leave its driest quarter short.
What do you need, and what conditions matter?
- 24 or more matching cups. Texas A&M AgriLife accepts any short or straight-sided container.2 Straight sides are best, because then the depth in the cup equals the depth that fell on the ground.
- Calibrated catch cans or food cans. Tuna or cat food cans work, but they are hard to level and need small rocks to hold them steady, so results are less accurate yet still useful.1
- A ruler or a graduated cylinder. A ruler marked in 1/16 inch (1.6 mm) cannot separate cups that differ by a few hundredths of an inch, but a cylinder marked in mL can.
- A timer and a zone sketch. Number every head and write in the spacing between heads.1
Pick a calm day and, if you can, run the test at your usual irrigation time. NMSU recommends wind of 5 mph (8 km/h) or less.1 Texas A&M AgriLife adds that the zone should run under normal operating conditions, especially pressure, so keep other water use off during the test.2
Check local watering rules
A test runs your sprinklers, and some cities limit which days and hours you may water. Confirm the rules with your water provider before you pick a test day.
Where do you put the cups, and how many?
Use at least 24 cups per zone. NMSU and Texas A&M AgriLife both give 24 as the minimum for reliable results.12 With 24 cups the low-quarter score rests on 6 readings.
Cup spacing by sprinkler layout
| Sprinkler layout | Where the cups go |
|---|---|
| Spray heads, irregular yard (most homes) | Rough grid 5–8 ft (1.5–2.4 m) apart across the zone |
| Spray heads in even rows, or rotors in an irregular area | Rough grid 10–20 ft (3–6 m) apart |
| Rotors in rows under 40 ft (12 m) apart | One cup 2–3 ft (0.6–0.9 m) from a head, then one every one-third of the distance to the next head |
| Rotors in rows over 40 ft (12 m) apart | Same start, then one cup every one-quarter of the distance |
Keep every cup at least 12 to 24 inches (30 to 60 cm) from the lawn edge. Source: NMSU Guide H-510.1 Texas A&M AgriLife gives the same one-third and one-quarter rule for heads in rows.2
For two rotors 36 ft (11 m) apart, put a cup 2 ft (0.6 m) from each head. That leaves 32 ft (9.8 m) between the end cups, and one-third of it is 10.7 ft (3.3 m), so the four cups sit 2, 12.7, 23.3 and 34 ft (0.6, 3.9, 7.1 and 10.4 m) from the first head. Set every cup upright and level. If one zone oversprays into the next, put cups in both and run both for the same time before you read anything.1
How to run the test step by step
- Inspect and repair first. Run the zone and look for broken or clogged heads, heads that do not pop up fully, spray landing on the sidewalk, and plants blocking a pattern.1 Fix them before testing.
- Sketch the zone and check conditions. Number the heads and write in the spacing.1 Wait for wind of 5 mph (8 km/h) or less and normal pressure.2
- Place and number the cups. Follow the spacing table, mark each spot on the sketch and level each cup. Use small rocks to steady food cans and take them out before you measure.1
- Run the zone and time it. Use the run times in the next section, write down the actual minutes, then shut the zone off.
- Read every cup. Measure promptly, record each reading against its cup number, and write down zeros too.
- Repeat for each zone. Ideally every zone gets its own test, though two zones with identical design can share one result.2
Tip: flag your cup spots
Push a pin flag beside each cup. After a repair, set the cups back on the same spots so the before and after readings compare fairly.
How long should the zone run?
Run the zone long enough for every cup to hold a readable depth. Texas A&M AgriLife suggests 5 to 10 minutes for spray heads and 10 to 20 for rotors, with at least five full rotations for large rotors.2 An Irrigation Association paper puts typical audit runs at 8 to 15 minutes, or until each can holds a readable volume.4
Expected cup depth by sprinkler type and test time
| Sprinkler type | Typical precipitation rate | Test run time | Depth in an average cup |
|---|---|---|---|
| Fixed spray heads | 1.25–1.5 in/hr (32–38 mm/h) | 5–10 min | 0.10–0.25 in (2.6–6.4 mm) |
| Rotor heads | 0.5–0.75 in/hr (13–19 mm/h) | 10–20 min | 0.08–0.25 in (2.1–6.4 mm) |
Depth = rate × minutes ÷ 60, pairing the low rate with the short run and the high rate with the long run. Rates from the City of College Station;5 run times from Texas A&M AgriLife.2 Multi-stream rotors apply about 0.3 in/hr (7.6 mm/h), so even 20 minutes collects only about 0.1 inch (2.5 mm).
If your cups hold less than the table suggests, run longer next time. If a cup nears the brim or the lawn puddles, stop early and use the actual minutes in the math.
How do you calculate precipitation rate from your cups?
Formula
Precipitation rate (in/hr) = average depth (in) × 60 ÷ run time (min)
Cups read in mL: depth (in) = average mL × 0.061 ÷ cup opening area (in²), which makes rate = 3.66 × average mL ÷ (area × minutes). Metric: rate (mm/h) = average depth (mm) × 60 ÷ minutes, and depth (mm) = average mL ÷ area (cm²) × 10.
Add up all the readings, divide by the number of cups, then scale the result to one hour. Include every cup, wet or dry. For a round cup the opening area is π × radius², so a cup 3.5 inches (8.9 cm) across has 9.62 in² (62.1 cm²).1 The 3.66 constant is the same method with the mL conversion built in.3
NMSU rounds the mL conversion to 0.06, which leaves the answer about 2% low, so use 0.061 or the 3.66 form.1 Then compare your result with the typical ranges above. A rate far below them often points to low pressure or worn nozzles.
How do you calculate distribution uniformity?
Formula
DULQ = average of the driest quarter of cups ÷ average of all cups
Sort the readings from lowest to highest. With 24 cups, the driest quarter is the 6 lowest. Use depth or volume, whichever you recorded, because the ratio is the same. Multiply by 100 for a percent.
A score of 1.0 would mean every cup caught the same amount. A score of 0.62 means the driest quarter gets 62% of the average.3 The low-quarter method is deliberately harsh: in a Texas A&M study of 236 sports-field stations it averaged 50%, against 62% for the Christiansen coefficient of uniformity, so never compare the two.4
Low-quarter DU ratings for turf sprinklers
| Rating | Fixed spray, minimum DU | Rotor, minimum DU |
|---|---|---|
| Excellent | 0.75 | 0.80 |
| Very good | 0.65 | 0.70 |
| Good | 0.55 | 0.65 |
| Fair | 0.50 | 0.60 |
| Poor | 0.40 | 0.50 |
Each value is the lowest DU that earns that rating. Source: NMSU Guide H-510.1 The Irrigation Association rotor scale matches the rotor column.4
The sources set the bar in slightly different places. NMSU says a system should at least rate “good,” while UC and Texas A&M AgriLife put the target at 0.7.132 Treat 0.70 as the goal and the “good” value for your head type as the floor. Below the floor, repair before you reschedule. The distribution uniformity calculator sorts the readings and returns the score.
Enter your cup readings, run time and cup size. The calculator returns precipitation rate and distribution uniformity.
Worked example: 24 cups on a spray zone
Take a lawn zone with fixed spray heads. You set out 24 round cups, each 3.5 inches (8.9 cm) across, run the zone for 10 minutes and read every cup in mL with a graduated cylinder.
- Cup opening areaπ × 1.75² = 9.62 in²
- Readings, low to high (mL)21, 23, 24, 25, 27, 29, 31, 33, 35, 36, 38, 39, 41, 42, 44, 45, 47, 49, 51, 53, 55, 57, 57, 58
- Total of 24 cups960 mL
- Average per cup960 ÷ 24 = 40.0 mL
- Average depth40.0 × 0.061 ÷ 9.62 = 0.254 in
- Precipitation rate0.254 × 60 ÷ 10 = 1.52 in/hr
- Driest 6 cups (mL)21 + 23 + 24 + 25 + 27 + 29 = 149
- Driest-quarter average149 ÷ 6 = 24.8 mL
- Distribution uniformity24.8 ÷ 40.0 = 0.62
- Run time for 0.5 in, average cup0.5 ÷ 1.52 × 60 = 19.7 min
- Run time adjusted for DU19.7 ÷ 0.62 = 31.8 min
- Average depth at 31.8 min0.5 ÷ 0.62 = 0.81 in
1.52 in/hr and DU 0.62: about 32 minutes to put 0.5 inch on the driest quarter
Metric: 40.0 mL over 62.1 cm² is 6.4 mm in 10 minutes, a rate of 39 mm/h. The driest quarter averages 24.8 mL, or 4.0 mm. A 13 mm target needs about 20.5 mm on average, and 32 minutes delivers it.
A DU of 0.62 rates “good” for a fixed spray zone, yet it sits below the 0.70 goal. It also costs real water. Delivering 0.5 inch to the driest quarter means applying 0.81 inch on average, which is 0.31 inch (7.8 mm) more than the lawn needs, about 190 gallons (720 liters) per 1,000 sq ft (93 m²) each time the zone runs. That waste is the argument for fixing the zone instead of adding minutes.
How do you set run times from your results?
Formula
Run time (min) = target depth (in) ÷ precipitation rate (in/hr) × 60 ÷ DU
Target depth is what one watering should apply, such as 0.5 inch (13 mm). DU goes in as a decimal. Texas A&M AgriLife divides the target by uniformity this way: 0.5 inch ÷ 0.67 gives 0.75 inch.2
The lawn watering schedule calculator returns days per week, the how long to water lawn calculator turns a depth and your measured rate into minutes per zone, and the scheduling coefficient calculator handles the DU correction.
The Irrigation Association auditor manual, as presented by UC, softens the correction with a multiplier of 1 ÷ (0.4 + 0.6 × DU).3 At a DU of 0.62 that is 1.30, giving 25.6 minutes instead of 31.8 and leaving the driest quarter near 0.40 inch, 80% of the target.
Then compare your rate with how fast the soil absorbs water, because water applied faster than that runs off. The same UC source lists about 0.4 in/hr (10 mm/h) for loam and 0.05 in/hr (1.3 mm/h) for clay,3 so the 1.52 in/hr spray zone above exceeds both. Where the rate exceeds the soil, split the run into cycles with soak time between. For poorly draining soil, the City of College Station suggests three 10-minute runs an hour or more apart in place of one 30-minute run.5 The cycle and soak calculator sets the cycle length, and the soil infiltration rate calculator estimates your soil’s rate.
What causes low uniformity and how do you fix it?
A low score points to hardware, not the schedule. Texas A&M AgriLife names pressure as a critical factor, because too little or too much both hurt uniformity.2
Pressure too low
Pressure too high
- Water breaks into fine droplets that evaporate faster and drift in wind.2
- Severe cases can blow out heads and fittings.2
- The available irrigation pressure calculator estimates what reaches the zone.
Pressure is only one cause. Check these as well:
- Mixed head types. At the typical rates above, a spray head applies roughly 1.7 to 3 times as much per minute as a rotor,5 so one zone cannot be right for both. The matched precipitation calculator checks whether replacement heads line up.
- Wide spacing. Each head should throw water to the next one. The sprinkler head spacing calculator compares spacing with throw radius.
- Tilted, sunken or clogged heads and blocked patterns. These are the visible problems from the first step of the test.1
Retest after repairs
Change one thing, then rerun the test on the same cup spots. Texas A&M AgriLife recommends annual auditing to catch problems before they grow.2 Retest sooner after a nozzle swap, head replacement or pressure change. Large, commercial and agricultural systems, and any zone that stays below the “fair” value after repairs, call for a certified auditor or irrigation designer.
Frequently asked questions
Can I do the test with fewer than 24 cups?
Yes, as a quick screen, but the score is rougher. With 12 cups the driest quarter is only 3 cups, so one odd reading can move the score a lot. NMSU and Texas A&M AgriLife set 24 as the minimum for reliable results, so use fewer only to spot gross problems such as a missing head.
What if a cup comes back empty?
Record it as zero if it sat inside the watered area, because it found a real dry spot and belongs in the driest quarter. Discard the reading only if the cup was tipped over, sat beyond the zone edge or was hit by another zone’s overspray. Then reset that cup and rerun the test.
Can I test two zones at the same time?
Only when their patterns overlap. NMSU advises putting cups in both zones and running both for the same time when overspray from one lands in the other, then reading all the cups. For zones that do not overlap, test one at a time so the extra flow does not pull down pressure.
Do I need to test every zone?
Ideally yes, because each zone has its own heads, pressure and layout. Texas A&M AgriLife notes that two zones with identical design can share one audit, a shortcut called linking. Do not link zones that differ in head type, spacing, nozzle size or slope, or where only one has been repaired.
How is this different from a bucket test?
A bucket test times how long a pipe or head takes to fill a container, which gives flow in gallons per minute. A cup test measures the depth of water landing on the ground, which gives precipitation rate in inches per hour and shows how evenly the water is spread. Flow is what the zone uses; cups show what the lawn receives.
Sources
- Kent, C. and Leinauer, B. (2013). How to Perform a Catch Can Irrigation Audit on a Home Lawn Sprinkler System. Guide H-510. New Mexico State University Cooperative Extension Service.
- Segars, C.A. and Fontanier, C. (2020). Tracking Every Drop: Irrigation Audits and Troubleshooting for Success. SportsField Management, March 2020. Texas A&M AgriLife Extension and Oklahoma State University.
- Oki, L. (2015). Maintaining Landscapes for Low Water Use: The New California Landscape. University of California, Davis, Department of Plant Sciences. University of California Agriculture and Natural Resources. Values attributed to the Irrigation Association Landscape Irrigation Auditor Manual.
- Swanson, C., Fipps, G. and McAfee, J. (2009). Calculation of Uniformity in Landscape Irrigation Auditing. Technical paper. Irrigation Association and Texas AgriLife Research and Extension Service.
- City of College Station, Texas. Smart Watering Tips. Water Services, Saving Water.
Written by Daniel Reeves, PE, CID. Figures in this article were calculated from the cited sources and checked against our lawn watering calculator. Read how we calculate and our editorial policy. Spotted an error? Tell us.